All projects
Dashboard · Data Visualization
Solo-EntwicklungSAP Monitoring
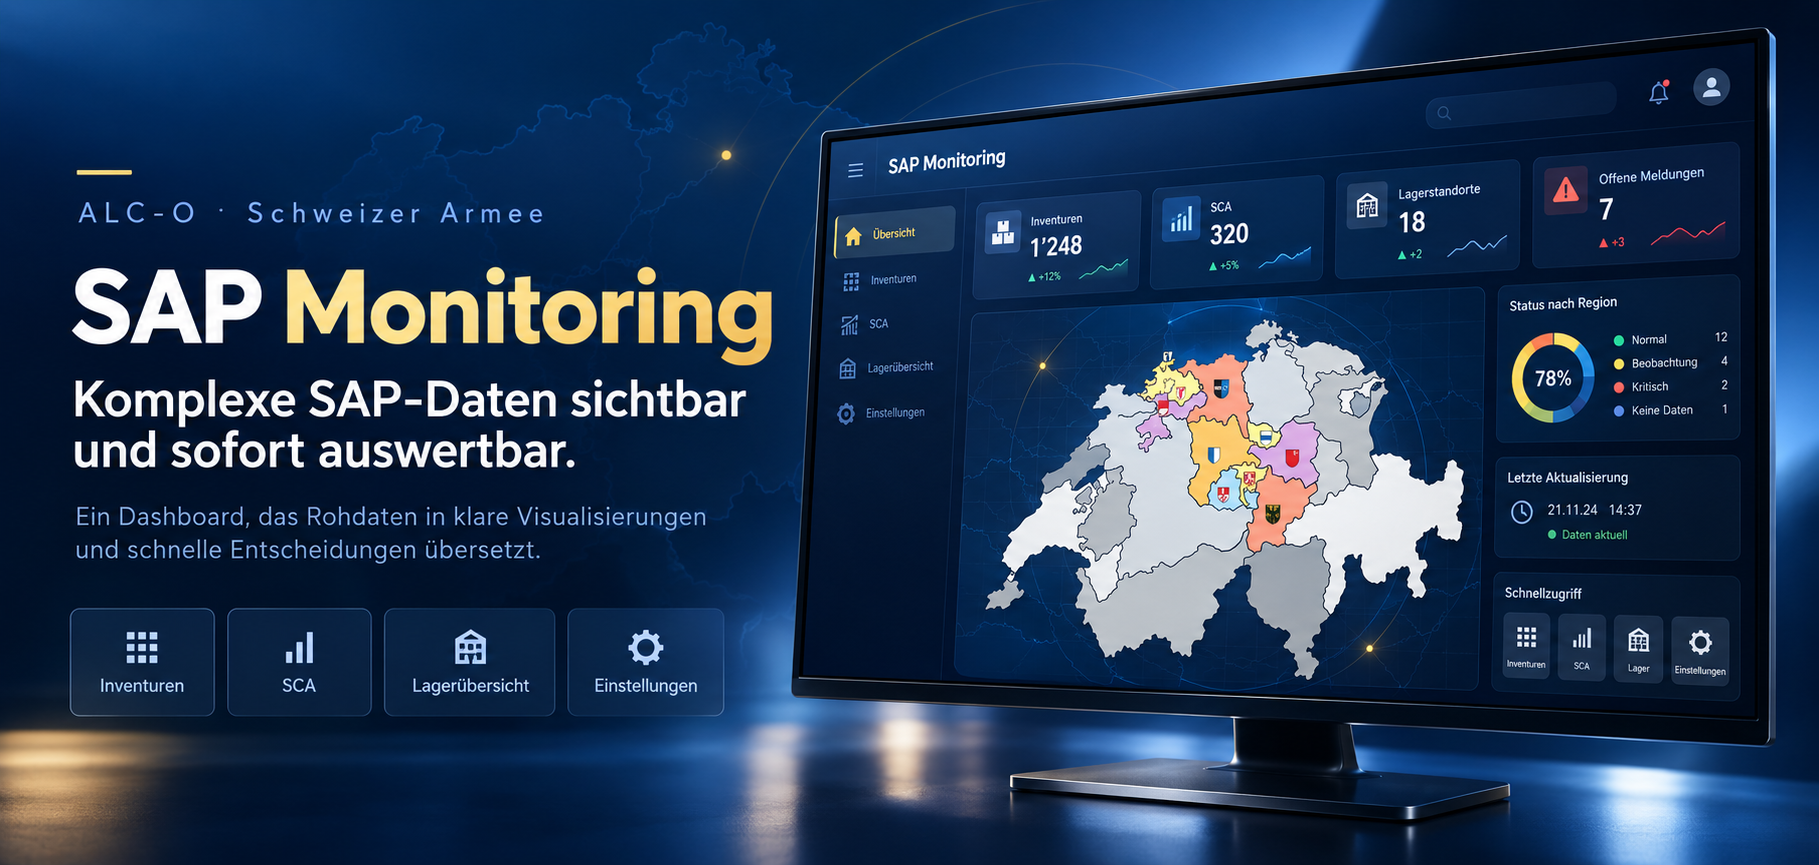
A dashboard that makes complex SAP data visible, understandable and immediately actionable.
- Angular
- NestJS
- Docker
“We now see in one minute what used to take half an hour of analysis.”
Created a data visualization tool using Angular and NestJS. Automated processing, filters and trend analysis provide high transparency.